xBee, Debugging, et al

Relatively Easy

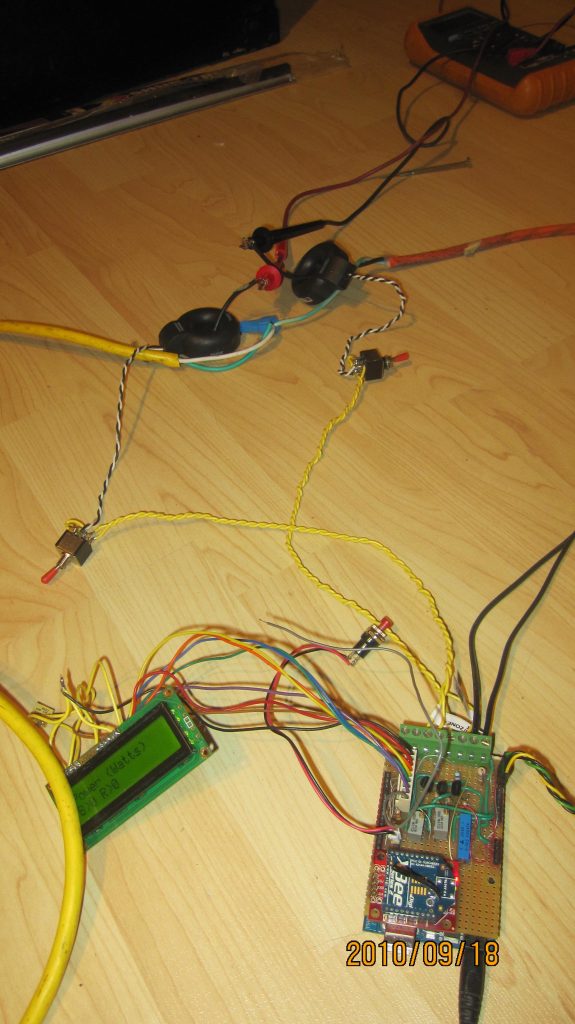
I’ve been busy with work and never have the time to get back to this project. Anyway, I penciled in a few hours to wire up the xBee transmitter/receiver to the arduino. The xBee explorer is a time saver. What I wanted to do is to program the arduino over wireless as well. Given that time is limited, I opted to just send data over wireless to simplify connectivity.

The xBee explorer had 4 connection points that made it easy to hookup:

  • +5 to arduino +5
  • gnd to arduino ground
  • dout to rx (pin 1 of ardiuino)
  • din to tx (pint 2 of arduino)

That is pretty all that is required to wire up the xbee. The explorer takes care of the 5v to 3.3v level shifting.  Remember I am using the Duemilanove as the reference board. Note that you can’t plug in the USB in the Duemilanove and xBee in the explorer at the same time. The two will conflict with each other. This is rather trivial to hook up so no wiring diagram other than pin connection mapping is provided.

On the host side, I used the USB explorer which is basically leads to a plug and play model which I like.  Rather than regurgitate xBee configuration, I found that it is well explained here. (Xbee Configuration tutorial)  I tweaked the PAN, Baud rate, and type. I made the host a coordinator and the slave device a routing type. Again, explained well in the tutorial.

Just like the other parts of this project, I found soldering and wiring it up the hardest. I used left over wire wrap wires (I think the stuff is 20 years old) to connect things. I don’t wire wrap them and still solder. I like it because it is not tot bulky. It does break easy though.   Anyway, I have a renewed appreciation for those who package hardware. Although mine works, only a mother could love the way it looks. Alas, it is for my own use so prototype mode is good enough.

xbee

Current Transformer Revisited

I revisited the current transformer wiring in the context of safety. Rather than use terminal blocks, I should have used simple audio jacks to simplify the wiring. Either way, there was a safety issue that loomed in the back of my head and I wanted to address it before wiring the sensors to the power mains. The secondary in an open circuit mode of a transformer (not connected to anything) can reach a high voltage and should it come in contact to a person, guess who is going to be the resistor for that voltage to close the circuit. You.  It does not take much to kill you.

What I did was add a switch that shunts (shorts) the secondary of the transformer that I flip to “field work mode” before handling the terminals.  This is not like shorting a 120 AC line. The voltage on the secondary is the function of the reflection of the impedance on the primary. This can get mathematical so I will spare the math. Suffice it to say that shunting the secondary won’t hurt the current transformer and will add another level of safety.

Host Software

Rather than re-invent the wheel, I thought there should be software out there that provides SCADA/HMI functionality for free. It is a commoditized activity by now.  After combing the web, I stumbled and settled on Mango, an open-source M2M solution. Mango is Java based that integrates with MySQL and runs under Apache. All good stuff so far.  The web site describes the features and how to install the software.  I liked the data historian, alarms, and the various types data points including calling external web based sources. I set one to get the external temperature at the airport and using regex to scrape of the temperature form the HTML. All within Mango.

I found it relatively easy to get going. One thing I had to do was write a Modbus function 6 (write a single register) for the Arduino in C as I want to send commands to the arduino. i.e. set the time for example.

The diagram below shows some of the points I configured to handle the home energy monitoring. I used ISA motivated nomenclature to name the tags. I may revert to a human readable tags as I won’t have hundreds of points and becomes cryptic after a while.

mango3

Data logging for each data point is configurable as shown in the screen shot below. The example is for the temperature in the basement. All of this info is in the MySQL database from which one can chose to slice and dice the data later on using external tools.

mango5

As for graphical objects, one can create custom objects e.g. dials, meters, etc. and assign tags to them. When this is all done I will add an iPhone friendly UI to this so I can interact with the home energy system on the road. One thing that Mango does is allow me to work on my solution rather than re-inventing the wheel.  I know have the facility to hook up multiple ardduinos and focus on the fun stuff which is the embedded side of things.

Just XBee Left Wire

I finally got around to spend some time on this and got everything on a perfboard . I also included a temperature sensor (LM35) along with a button to select the LCD display mode.  If I had to change one thing, I would chose different connectors so I can disconnect the current and voltage sensing wiring without screwing on a terminal block. I removed the CT and voltage wiring to the terminal block in the picture.

IMG_2643

Given that I will be working with two current transformers any open circuit can be lethal. I will  add a switch that short circuits the secondary before I disconnect from the terminal blocks. The last piece to connect will be a XBee chip to send the data to the master. As stated early, I am using Modbus over serial as the protocol to communicate with the host.

One thing that did give me grief is that the temperature reading was erratic under certain scenarios.  I sampled the currents and voltage to get 2000 samples do some computations and then take a sample of the ambient temperature. If I did not perform the 2000 sample burst, I got a stable temperature reading. If I looped for sample 2000 readings then took a temperature, the temperature would be erratic.  I still don’t know why and my hunch is that it lies in the A/D mux in the Arduino.  What I did was take average 10 temperature readings with a delay of 20 ms between sample which led to a more stable temperature reading.

All that is left is to mount an XBee chip on the bread board and the hardware should be ready to stuff into an enclosure.

Host Communication

Modbus

Well I got around to dabbling with how to best communicate with a host to implement a data historian. I started writing a extremely dumbed down protocol inspired by Modbus  After a day I realized that why settle for less and figured that pure Modbus would be better.  I could then use Modbus master software to query my Arduinos.  I found a Modbus C code for the arduino to provide RTU slave functionality over serial line. I loaded the sketch and downloaded a Modbus tool to read some values from the arduino to see if it all worked. There is only support for Modbus function 3 and function 16 in the arduino implementation and I added code to handle function 6. If you know enough C it is rather straightforward.

Java Host

Now that connectivity using Modbus was feasible, I wanted to ensure that I could implement a data historian with open source tools and decided that Java was the way to go.  After all Apache Tomcat, mySQL, and the eclipse dev environment are free and just require wetware to use. I also wanted to have my own arduinoController to collect the energy information that abstracted the details of Modbus.  After combing the net, I quickly realized that there was no reference implementation from Sun or whatever they are called now for Win32 serial data com. I will use Linux later  host it all later, but wanted a platform independent solution.  I found RXTX as a potentially viable implementation and free! Now all I need is a Java implementation of a Modbus not surpisingly, that exists too at jamod.

What I hate is screen painting and UI work can be a  pain. I wanted a simple java application to test read/write of registers and display them in float, long, int, unsigned int, binary, and hex formats. It would be a way for me to understand the details further and I would not have to deal feel guilty using commercial software as a trial offer.  I digressed in my focus and looked for a tool that would allow me to create UI with minimal effort. I found JformDesigner to be flawless and will probably purchase it.  It installed in Eclipse without a glitch and a Luddite like me was productive in a matter of hours. Anyway after a couple of days, I had the RXTX source compiled and my arduinoController source integrated to provide a simple test tool for me to experiment with. The screen shot is shown below. The challenging part was how to display longs and floats as Modbus does not support floats and longs per say and is something one does at the application layer (for you OSI compliant people)

modbus tool

Representing Float

For those that are interested, to get implement a float from a Modbus register representation, one just has to do this

Arduino Side

It takes two registers ( 16 bytes in total to represent the float). One may ask how does one mash a float into ints on the arduino side? I used the union

union
{
int regsf[2];
float value;
} mashedFloat;

I used it as holding area to mash my floats into to registers.

e.g.  mashedFloat.value = powerfactor

regs[0] = mashedFloat.regsf[0];
regs[1] =
mashedFloat.regsf[1];

Java Side

The data flows over standard Modbus to the host and on the Java side do something like this to unmash into a float.

float x = Float.intBitsToFloat( (mRegisters[i+1].toShort() & 0xffff) << 16 | (mRegisters[ i].toShort() & 0xffff) );

Modbus Registers

I captured how I will represent my power metrics from the main panel and send over Modbus. Rather than waste 2 registers for floats to represent something like 118.1 volts I will cast it into a single register as a 1181 and convert back on the host. The reason for this, on the Arduino Duemilanove, there is only 2k of RAM and I created my power calcs using classes and that is not cheap on memory.  I plan on taking the Modbus code I found on the web and make it class as well.  I will have other arduino’s in the house collecting spot power measurements and must ensure that I can upgrade code (read fix bugs)  in a consistent manner.

Tag Line Voltage Units Type R/W Offset
EI-011 Black Line Voltage Vrms short R 0
EIC-011 Black Line Voltage Crest Factor short R 1
CI-011 Black Line Current Irms short R 2
CIC-011 Black Line Current Crest Factor short R 3
CI-021 Red Line Current Irms short R 4
CIC-021 Red Line Current Crest Factor short R 5
KD-011 Black Delta T between Samples ms short R 6
KD-031 Red Delta T between Samples ms short R 7
TI-001 Local Temperature C short R 8
JI-011 Black Line Real Power Watt float R 9
JI-021 Red Line Real Power Watt float R 11
JIA-011 Black Line Aparrent Power VA float R 13
JIA-021 Red Line Aparrent Power VA float R 15
JIR-011 Black Line Reactive Power var float R 17
JIR-021 Red Line Reactive Power var float R 19
JIP-011 Black Line Reactive Power Factor float R 21
JIP-021 Red Line Power Power Factor float R 23
GC-001 Display Mode short W 30
GC-002 Number of samples per calculation short W 31
KC-001 Time sync (unix time) s long W 32

CO2 and kW*hr

On the arduino side, the CO2 produced and the kWatt*hr are accumulated over a 24 hour period and displayed on the LCD. I plan computing those on the host side rather than send over Modbus . I have all the raw data to do that and do statistical operations as well as part of the data historian. e.g. average CO2 per day, Standard Deviation, etc.

Prototyping – Part II

There is not much to this. A protoshield, the arduino, and a breadboard. Note the current transformer (donut). I have two of those to use in the panel.

IMG_1426

The first test was to plugging in a 60 W lamp to see what the measurement came too. I expected around 0.5 Amps and 60 watts. I was not disappointed.  I proceeded to plug in a toaster and put the ammeter in the circuit to see if my RMS current matched its RMS measurement. The photo below shows a .4% error. Not bad. Note the drop in the line voltage.

In Canada, the nominal line voltage is 120Vrms. I do measure the voltage as part of my power calculations and when I saw the 113 V I checked with the multi-meter and it read the same.  Assuming a 120 V reference would lead to errors in the power calculations. I should not be running a toaster outside my 20Amp line in the kitchen. I created a suicide cord that threads through the current transformer and is basically an extension cord. It plugs into a 15Amp line with other loads. 120 down to 113 is just over a 5% difference from the nominal line voltage. I am trying to rationalize why such a large dip. Anyway, the power measurement works.

IMG_1421

Crest Factor

The crest factor is the the ratio between peak and RMS signals. I do compute that and it gives me an idea on the shape of the waveform. A sinewave should have a crest factor of \sqrt{2} . The 60 W lightbulb had a crest factor of 1.40 for the voltage 1.40 for the current. Close enough.

I plugged in a variable speed drill and ran it a low RPM. As expected, the power factor went down to .27 with most of the power becoming reactive at 104 vars. The real power was just a mere 29.5 watts. The crest factor for the voltage was 1.39 and for the current, 3.96. That is expected as the duty cycle is changed to control the speed. For us home owners, we get charged for the real power consumed.  In industrial environments, the power company would penalize you for running with such an awful power factor.

I can’t wait to plug all this in the main panel see what the overall power consumption profile is. I expect the power factor to be closer to one.

Next Steps

Computing C02 emissions is trivial as well as projecting cost of power usage.  I would like to have that wired next to the power panel and displayed on the LCD sooner than later.  On the other hand, I need figure out the zigbee side of things as well as how to best do the data logging.  I can easily purchase another arduino later and focus on getting this prototype soldered on something more permanent.

Prototyping – Part I

Well I finally got around to get some code and test things out. Without known test loads and an oscilloscope, testing shall require some creativity.  Armed with a multimeter I began testing things out.

Software

The longer term plans include creating spot measurement devices  using the arduino and rather than slapping the code and copying and pasting stuff around, I opted to create a couple of classes to facilitate reuse. It took some trial and error to understand how to add classes to the arduino dev environment and could never get multiple inheritence to compile in the environment. I assumed the problem was between the keyboard and the chair.

I ended creating two classes: ACSignal to help capture and compute some basic stuff like average, RMS values. The PowerSignal class takes two ACSginal references and computes apparent power, real power, etc.

The code to use the classes is rather simple. Converting the float to alpha–since the LCD4Bit library does not handle spitting out floats–took more time that I wanted.

As explained earlier, the math looks more complicated than it is. The two main formulas are shown below along with the corresponding code to implement it. Anti-climatic if you ask me, but nice to see the stuff working.  As long as the sampling rate is much greater than the highest frequency component, things should be good to go. I take 2000 samples display stuff and resample.  Since this is all this arduino does I don’t need interrupt driven sampling periods. The maximum sampling rate for the ATMEGA chip on the arduino is around 9600 hz.  More than enough for this power line sampling.

P_{avg} = \frac{1}{N}\sum_{n=1}^{N}v_ni_n \approx \frac {1}{T}\int^{to+T}_{to}p(t)dt \qquad(1) X_{rms}= \sqrt{\frac{1}{N}\sum_{n=1}^{N}x^2_n} \approx \sqrt{\frac {1}{T}\int^{to+T}_{to}x^2(t)dt} \qquad(2)

@@

void PowerSignal::updateAccumulator()
{
  mSumVoltageTimesCurrent += mVoltageSignal.getInstantaneousValue() * mCurrentSignal.getInstantaneousValue();
}

float PowerSignal::computeAveragePower()
{
 return( mSumVoltageTimesCurrent / mVoltageSignal.getSampleCount() );
}

float ACSignal::acquireSignalSample()
{
 float lVal;

 mCurSample = analogRead( mPin )  ;
 mCurVoltage = mCurSample * PS_VOLTS_PER_STEP;
 mSampleCount++;
 mSumVoltageRaw += mCurVoltage;
 mRealVoltage = mCurVoltage - mDCOffset;  // remove DC offset from circuit voltage divider
 lVal = getInstantaneousValue();
 mSumVoltageSquared +=  lVal * lVal;

 if( lVal > mMax )
 mMax = lVal;

 if( lVal < mMin )
 mMin = lVal;

 return( lVal );

}
float ACSignal::getRMSValue()
{
 float lRMSValue = PS_PWR_CALC_ERR;
 if( mSampleCount > 0 )
   lRMSValue = sqrt( mSumVoltageSquared / mSampleCount );
 return( lRMSValue );

}

Analog Interfacing

Time to plan to interface to the  Arduino. The constraint is that the inputs can only be 0-5 volts.  So no negative voltages.

Measuring the Line Voltage
I am using a 9VAC 1.5A wall wart to step down the voltage. To shift voltage into a 0-5 range, I used the following circuit. All I have is a digital multi-meter that measures true RMS. Open circuit measured came in at 10.5 Vrms.  I assume it is  sinusoidal so the peak-to-peak voltage is

10.5(\sqrt{2})=14.8 Vp-p

The plan was to shift that into a 2.5Vp-p centered around 2.5V which will give me the required 0-5V.

power voltage interface

A 2.5 voltage reference zener diode was used to shift the voltage up 2.5 volts. The potentiometer was used to tweak the RMS voltage to \frac{2.5}{\sqrt{2}}=1.77 Vrms

Measuring Current
Current measurement followed  similar approach. The current transformer with a resistor in placed across the terminals produces a voltage proportional to the current. The spec sheet for the CR8459-2000-N states that the voltage is defined as

V = \frac{IR}{T_e}  where T_e  for this CT is 2011.

It would be difficult to test this in the panel installation so max current, I,  at 7.2 amps for the bench. I will need to debug stuff and will change the current to 100A when I stuff it in the panel. Note I need to do this circuit twice since I have 2 100 Amp measuring points. So solving the formula for R and setting I =7.2 and V=7.2 and using the given T_e we get R=\frac{VT_e}{I} = \frac{(7.2)(2011)}{7.2}=2011 \Omega

The diagram below shows how the current measurement was interfaced. Again the potentiometer was used to tweak the  RMS voltage to \frac{2.5}{\sqrt{2}}=1.77 Vrms

power current interface

The R or potentiometer value will change to value of 145 \Omega   when I permanently mount the current transformer to reflect a higher current range.

Hardware

Measuring Current

There are two ways I am willing to entertain for measuring current. One is via a current transformer and the other vial hall effect.

I combed the web to look for affordable devices in North America. It seems that Europe has access to cheaper current transformers.  I ended purchasing three  (3) current transformers and two(2) hall effect chips.

Two (2) revenue Grade Current Transformer Two from CR Magnetics to install on each side of my 200A pannel per each side  (CR8459-2000-N)

One (1) general purpose 0-20A for experimentation CR Magnetics  (CR8410-1000)

Two (2) Hall effect bases chips from Allegro ACS712ELCTR-20A-T

I ordered on-line via Digi-Key and found to have an excellent customer experience. I opted for one stop shopping for other goodies such as zigbee chips and other odds and ends. I also wanted something Canada friendly so I picked a place that operates in both Canada and US.

I entertained the idea of spit-core transformers to facilitate wrapping around the wire. I could not find some at a cheap rate and figured some higher quality ones could be used for permanent installation. I’ve done enough wiring to feel comfortable inside the panel box. I would not recommend venturing in high voltage areas without a good understanding what can harm you. Get an electrician to wire those if you have any doubts.

Measuring Voltage

I have a bunch of AC transformers lying around so I plan on using those to measure the AC voltage.  120:10 volts p-p will do as that is all I have in stock.

Embedded System
I entertained the idea of using a multi-tasking OS such as The FreeRTOS Project and finding a board to host it. The KISS principle forced me to focus on deploying hardware to perform specific tasks and avoid creeping elegance. I only want a device that at will feed into the mesh network. No sense over engineering things. I can use the FreeRTOS for a data concentrator later on. There were many choices out there e.g.  PIC and Micromint. I opted for simplicity and went with the Arduino Duemilanove.

I purchased my Aduino from spikenzielabs along with the following to help me get ball going.

  • Arduino Duemilanove w/ Atmega328
  • XBee Explorer USB
  • Adafruit Proto Shield for Arduino
  • Basic 16×2 Character LCD – White on Black 5V
  • Breakout Board for XBee Module

power parts

Time to plug things in and see what happens.

Discrete Time Equivalents

Earlier I spoke about modeling the math to simulate the calculations that I will be using in my home grown energy monitoring system. I think I have a good enough grasp on the math to come up with the algorithm to use in the software. Specifically, the computation of RMS values and average power.

P_{avg} = \frac{1}{N}\sum_{n=1}^{N}v_ni_n \approx \frac {1}{T}\int^{to+T}_{to}p(t)dt \qquad(1) X_{rms}= \sqrt{\frac{1}{N}\sum_{n=1}^{N}x^2_n} \approx \sqrt{\frac {1}{T}\int^{to+T}_{to}x^2(t)dt} \qquad(2)

The simulation implemented both these and the integration functions to compare results. We are dealing with low frequency power line signals of 60hz which in theory we need to sample at 120 times per second. The reality is that there will be higher frequency components such as harmonics and we would need to sample at a higher rate capture those effect and ensure we can compute true RMS values.

Don Lancaster’s Tech Musings provides an excellent summary about measuring power s and pitfalls in trying to measure it.

I think I have enough theory and now ready to start building something.

Modeling the Math

I used Excel to enter the power calculations on a simulated data set (voltage and current). I later wanted something more responsive to what-ifs and designed for mathematical computation. I stumbled on a MatLab like open source tool cal GNU-Octave. I decided to download and install the tool to enter basic power calculations.

What I like about this tool and like Matlab is the ability to manipulate matrices and vectors. I can set up calculations for my power without resorting to annoying for loops. With my short attention span, I liked this.

Earlier I described the basic math and reduced the following salient equations:

P_{avg}=\frac {1}{T}\int^{to+T}_{to}p(t)dt\qquad(1) I_{equiv}=I_{rms}=\sqrt{\frac {1}{T}\int^{to+T}_{to}i^2(t)dt} \qquad(2) P_{avg} = V_{rms}I_{rms}cos(\Theta_v-\Theta_i) \qquad(3))

For giggles, I wanted to use Octave to calculate and plot power curves. I know from sampling theory that we need to sample at least at the Nyquist frequency to be able to reconstruct the signal.The reality is we don’t live in an ideal world with perfect filters. More about sampling rate later.

I created functions in Octave to generate a waveform. I can also import a text file with data values and compute the various types of powers as well. I wanted to test a couple of sunny day scenarios to ensure that my calculations were correct. I took two approaches. One I actually defined the function and let Octave integrate it. The other was to sample the function like I would in the software. Both yielded the same results. The table below outlines the expected and actual results.

Package/ToolURLDescriptionInstallation
log4jslog4jslog4js based logging services for node.jsnpm install log4js -S
monkmonkwrapper to mongodb that is simpler yet not as powerful as mongoosenpm install monk -S
nodemonnodemonlistens for file changes and restarts server npm install nodemon -g
dummy-jsondummy-sontool to generate JSON files used for my testingnpm install dummy-json -g
RobomongorobomongoMongoDB managerdownload and point to mongoDB instance (default localhost:27017)
Bluebirdbluebirdpromise library implementationnpm install bluebird -S
SerialPortserial portserial port driver for node.jsnpm install serialport -S # have 4.0.7
xbee-apixbee-apixbee API for node.jsnpm install xbee-api -S

I also generated an odd current waveform that could occur in speed control via a triac or something and ploted the graph below.

SCR

Intuitively one would expect the average power to be half of the sunny day scenario. The other half is reactive power. The following shows the power calculations for varying sampling rates.

[table “3” not found /]