
Continuing from my last post, this part covers how I setup docker-compose on the Pi 4 OS64 to help me recover from a system failure.
Learning Docker Compose required some effort. Using the scripts at IOTStack works for the most part but one is no better equipped to troubleshoot if something goes wrong.
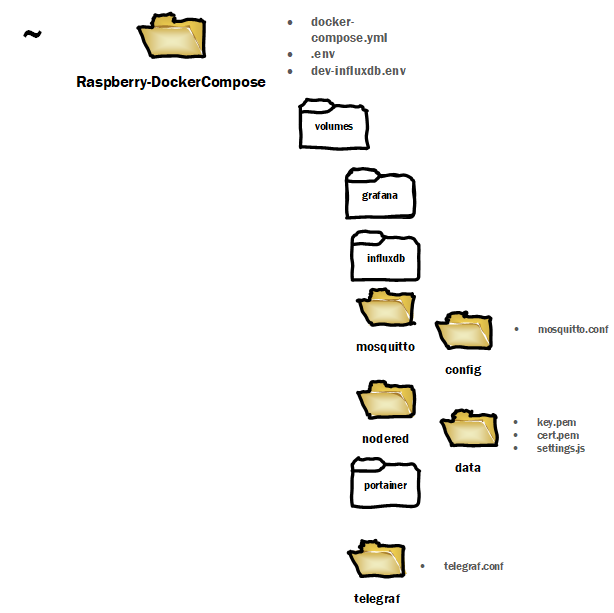
The file used configures Node-RED, InfluxDB 2, Grafana, MQTT, Portainer, and Telegraf can be found at https://github.com/chrapchp/Raspberry-DockerCompose. Telegraf was not needed but included anyway to demonstrate that it does work by pushing system info to influx.
Docker compose was run on both the Pi OS64 and Windows 10. This setup is not meant for production environment as it falls short on security. A dev-ops mess. The github repo has pem, .env files which are an anti-patterns. Please refer to sources like this to properly manage secrets.
Back of Napkin Requirements
Node-RED
- SSL via self-signed certificate
- user/passwords configuration as default
- Config, flows, additional components saved outside of docker container
- Parked – SSL certificate by trusted authority
- Parked – Reverse Proxy
InfluxDB
- Use Version 2
- Config is preset so when docker compose runs, no additional configuration required
- Test with python and push three sinusoidal signals at different frequencies
- Parked SSL
MQTT
- Accept any connection with no authentication
- Parked – Config should allow for authentication
- Parked – SSL
- Parked – Authentication
Telegraf
- Work without configuration and publish system metrics to Influxdb
- Parked – SSL
Grafana
- Work with InfluxDB V2
- Parked – SSL
- Parked SAML
- Parked – Reverse Proxy
Getting Started
Preconditions:
- Pi OS 64 installed ready for ssh. How-to found here; scroll to bullseye section and follow instructions. Latest images here. My system is on an SSD and how-to can be found here.
- Docker via convenience scripts run from home directory and running as a service. Could work with Debian Arm64 but did not try that the time of writing.
curl -fsSL https://get.docker.com -o get-docker.sh
sudo sh get-docker.sh
sudo systemctl enable docker
- Docker Compose – Install instructions using Alternative Install Options Python 3 is installed as Pi OS64.
pip3 install docker-compose
Steps
Under your home directory. e.g. cd ~ under Linux or c:/user/theuser/ under Windows 10
git clone https://github.com/chrapchp/Raspberry-DockerCompose.git
or if you don’t like the Rasperry-Docker-Compose folder as the name, pass the desired folder name to the git command. e.g. to clone into folder XYZ or c:\sandbox
git clone https://github.com/chrapchp/Raspberry-DockerCompose.git XYZ
git clone https://github.com/chrapchp/Raspberry-DockerCompose.git c:\sandbox
Note your will have to edit the .env file under the cloned repo directory reflect the non-default folder. BIND_VOLUME_ROOT=~/Raspberry-DockerCompose
BIND_VOLUME_ROOT=~/XYZ
BIND_VOLUME_ROOT=c:\sandbox
Docker compose will create the host volumes automatically and keeps existing data intact if they exist. e.g. the config files.
Edit ~Raspberry-DockerCompose/.env or wherever you cloned to repo and change the INFLUX_IP to the device that is running docker-compose. e.g.
INFLUX_IP=192.168.1.86
From a terminal run the following. In my case I was in ~ Raspberry-DockerCompose
docker-compose up
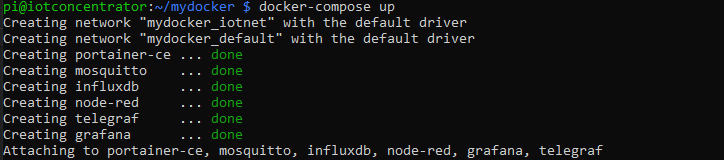
Docker will download the required images and display something like the following on the terminal.
Smoke Test
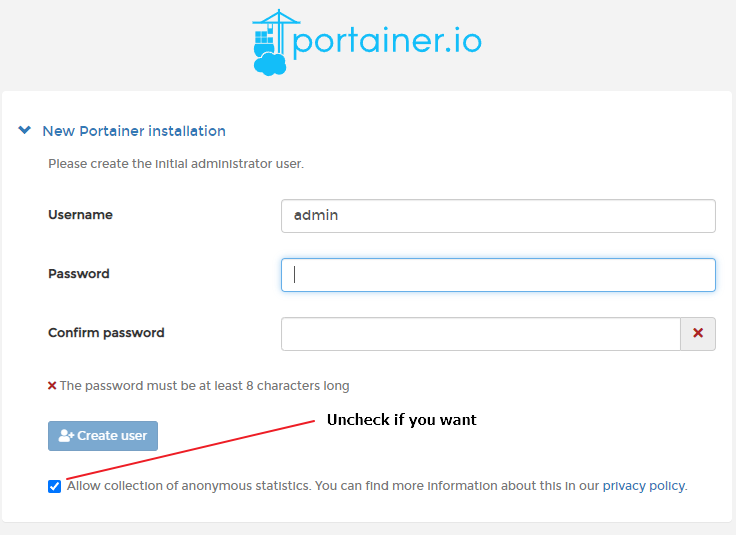
Portainer
Open your browser and navigate to https://<ip>:9000. You will prompted to change the admin password. Provide one and proceed to login.
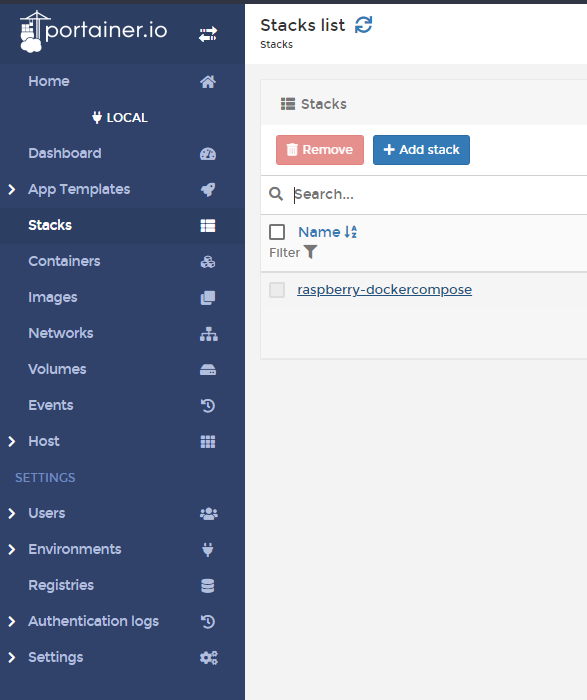
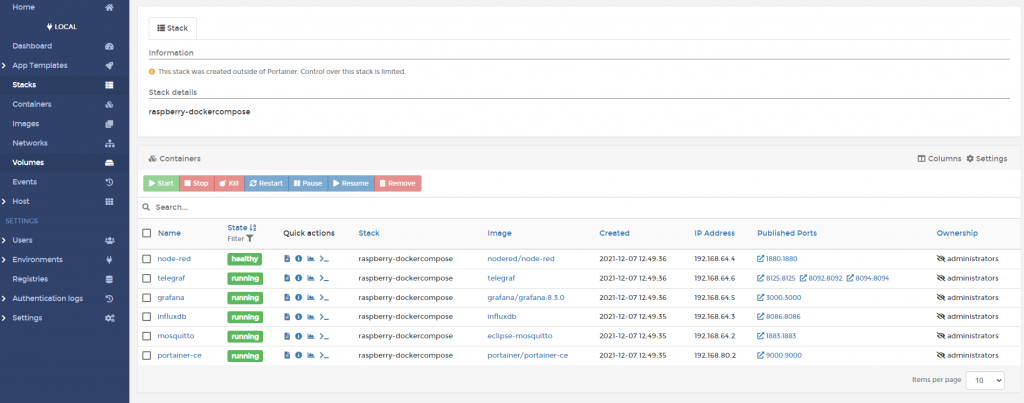
Click on stacks and following the raspberry-dockercompose link and the six container will show up. Explore as you see fit.
Node-RED
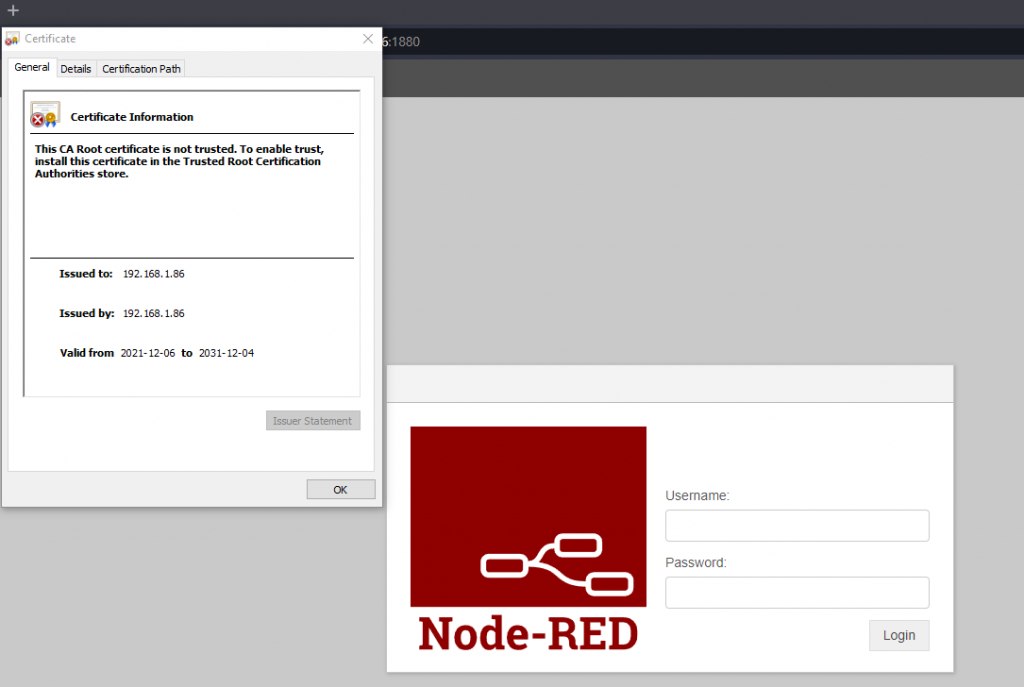
Open your browser and navigate to https://<ip>:1880 to log into Node-RED. Change the <ip> to the address reflect your device IP. The repo has a self-signed certificate that really is not useful beyond getting images up an running with SSL. The certificate is untrusted since it was self-signed.
Login with admin/changeOnInstall
To generate a your own certificate cd into ~Raspberry-DockerCompose/volumes/nodered/data and run
sudo openssl req -newkey rsa:2048 -new -nodes -x509 -days 3650 -keyout key.pem -out cert.pem
Since it is self-signed, most of the information can be defaulted since nobody outside will trust it anyway. Note Common Name (e.g. server FQDN or YOUR name) is set to your devices IP. e.g. 192.168.1.23
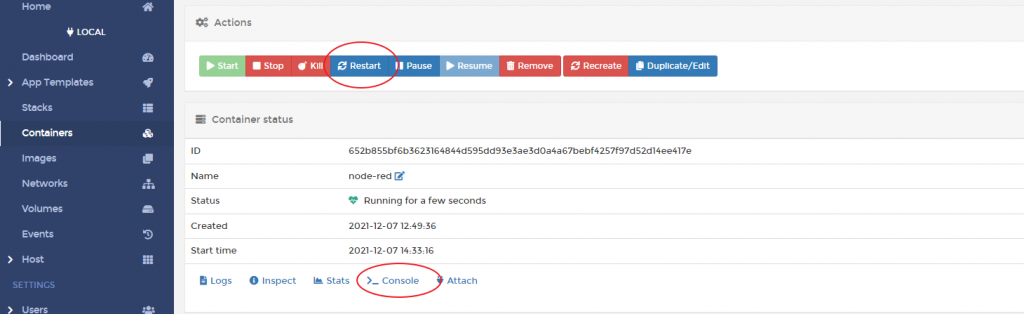
Changing the admin password. This requires running a node-red command which can be done from the terminal or via Portainer.
From a terminal run
docker exec -it node-red /bin/bash
Or from Portainer select console, then connect.
Then run.
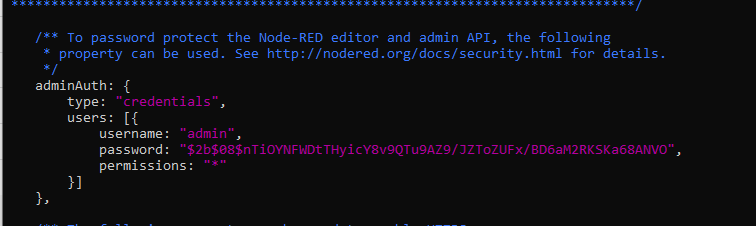
node-red admin hash-pw
You will be prompted a password, provide on and a hash will be created to copy into setup.js. Copy the hash.
Assuming you are still in Raspberry-DockerCompose/volumes/nodered/data, edit setting.js and change the admin entry’s password to the new hash. (copy and paste)
Restart node-RED to implement changes. Flows and installed libraries reside in the data folder. If you have a new docker-compose environment, copy this folder and below to the new host-volume if you want to preserve settings.
InfluxDB
Open your browser and navigate to https://<ip>:8086 to log into influxdb. Change the <ip> to the address reflect your device IP. The username/password is theUser/changeOnInstall as defined in the dev-influxdb.env.
DOCKER_INFLUXDB_INIT_MODE=setup
DOCKER_INFLUXDB_INIT_USERNAME=theUser
DOCKER_INFLUXDB_INIT_PASSWORD=changeOnInstall
DOCKER_INFLUXDB_INIT_ORG=theOrg
DOCKER_INFLUXDB_INIT_BUCKET=theBucket
DOCKER_INFLUXDB_INIT_ADMIN_TOKEN=makeMeComplicated
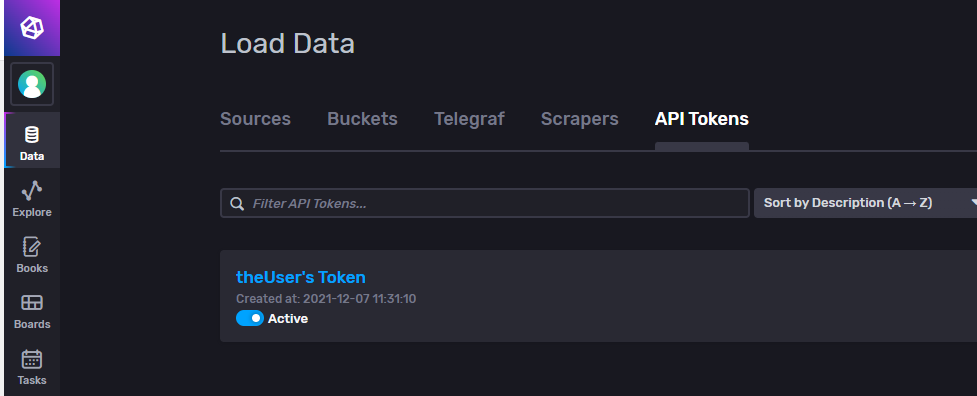
Navigate into Data and then into API Tokens. You will notice the token for a “theUser”. Drill down in that token. The value is set to makeMeComplicated.. This is the same token used for telegraf which is not a good practice but good ok for learning.
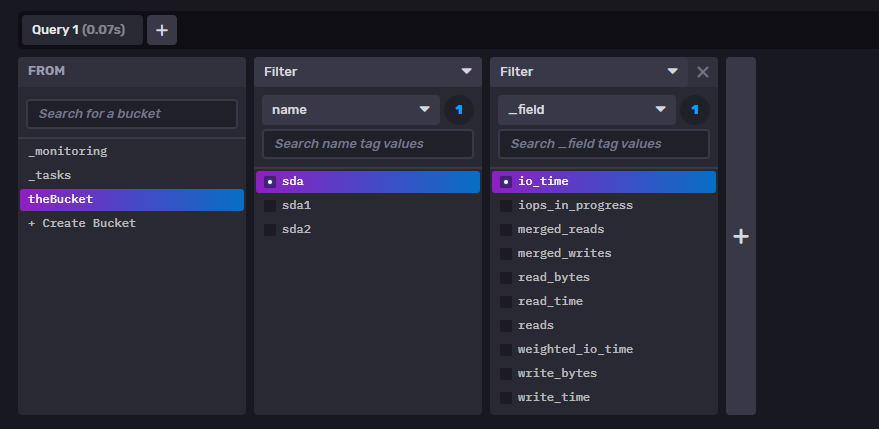
Click on explore. Select the theBucket, filter name=sda, and _field=io_time and submit. A plot will appear implying that telegraf is running ok.
From the terminal, change to ~Raspberry-DockerCompose or whatever you cloned the repo into. On a Pi OS64, pip3 is already installed. Run
 pip3 install matplotlib
 pip3 install influxdb_client
If you ssh’d in matplotlib won’t do anything useful. Either way , run and wait about 20s.
python ./injectSigals.py
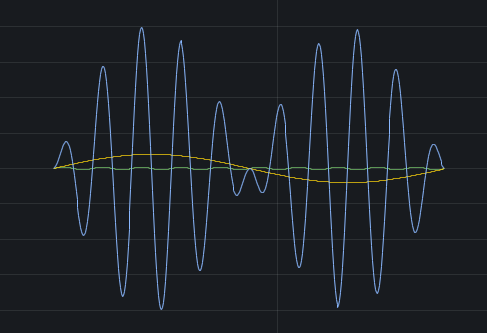
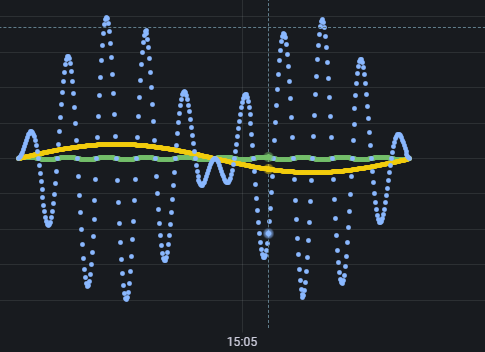
Got back to influxDB url and select explore. You may have to refresh your browser. Select filter=tag and check carrier, message, modulatedAM. .
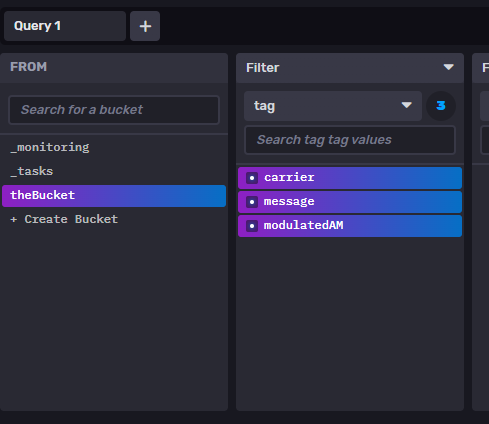
Select past 15m, go into custom window period and change to 1s. The python code injects samples at the 1s resolution. Click submit and a waveform like the following should appear.

Grafana
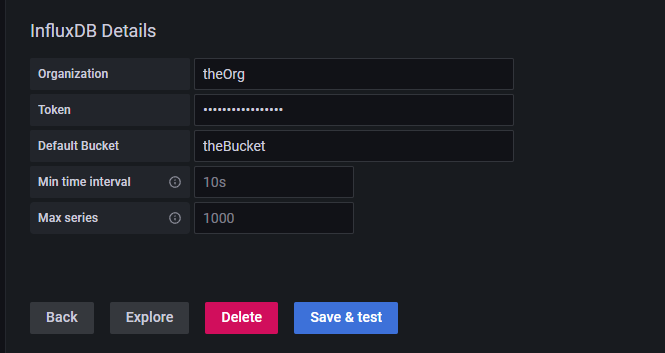
Open your browser and navigate to https://<ip>:3000 to log into influxdb. Change the <ip> to the address reflect your device IP. Default user/password is admin/admin. Change the password when prompted. Select Data Sources then select InfluxDB

Select Flux as the query language and turn off Basic auth. Ensure the URL points to your device IP. Port defaults to 8086.
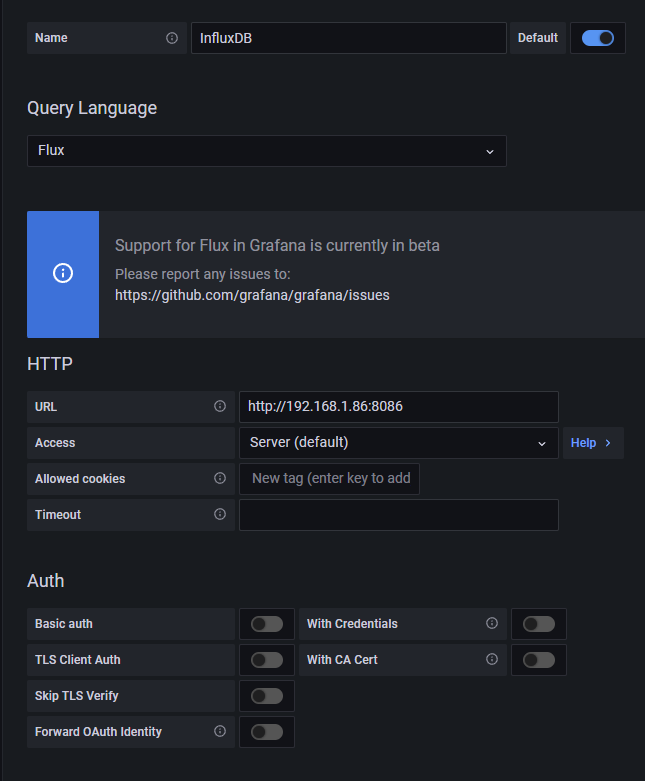
As per dev-influxdb.env, set Organization to theOrg, Token to makeMeComplicated, DefaultBucket to theBucket. Save & Test.
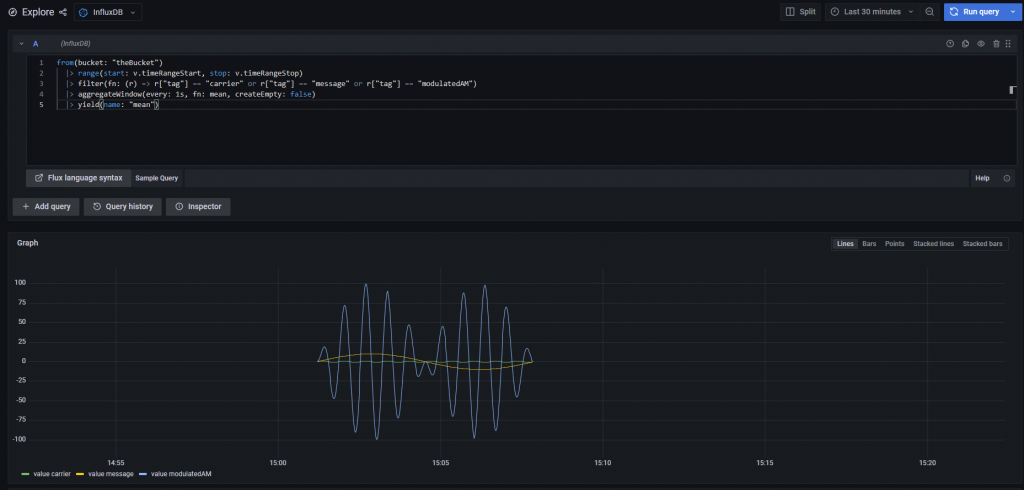
Go to Explore, ensure InfluxDB source and paste the following for the query. Run the Query. Depending how long ago you did the injectSignals.py you may have to change the period on the dropdown.
from(bucket: "theBucket")
  |> range(start: v.timeRangeStart, stop: v.timeRangeStop)
  |> filter(fn: (r) => r["tag"] == "carrier" or r["tag"] == "message" or r["tag"] == "modulatedAM")
  |> aggregateWindow(every: 1s, fn: mean, createEmpty: false)
  |> yield(name: "mean")
If all works, three signals should appear.
MQTT
On Windows 10, install mqtt-explorer.com, start it up and create a new entry with the proper IP address to your device, and connect.

On Linux, run
sudo apt install -y mosquitto mosquitto-clients
In one terminal, run for the subscriber
mosquitto_sub -d -t YourTopic
In another terminal, run the publisher
mosquitto_pub -d -t YourTopic -m "Hello world!"
Hello World! will appear in the subscriber terminal.
System Restart
Since docker is a service and the the restart-policy for each docker compose serve is set to restart: unless-stopped, all that is required to run restarts on system startup. Tested under Pi OS 64.
